在现代前端开发中,数据可视化是提升用户体验的重要手段之一。虽然像 ECharts 这样的成熟库已经能满足大部分需求,但亲手实现一个简易版本的图表绘制工具不仅能加深对图形编程的理解,也能带来极大的成就感。本文将使用 HTML、CSS 和 JavaScript 实现一个类似 ECharts 的交互式折线图。效果演示
折线图支持多个系列同时展示,并配有不同颜色区分,鼠标悬停时出现提示框显示具体数值,底部图例可控制各条折线的显隐状态。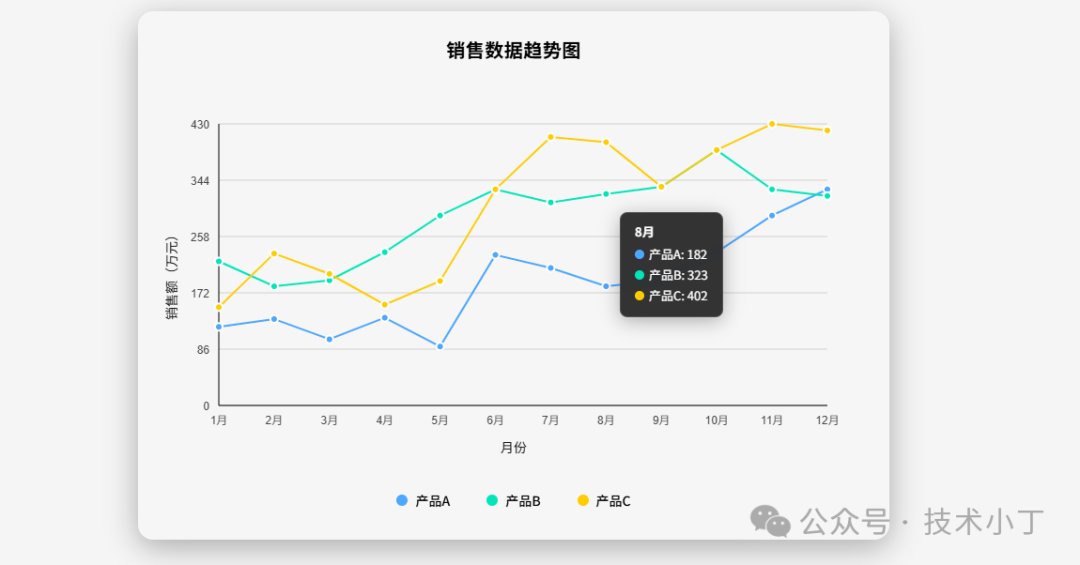
页面结构
整个页面采用简洁清晰的结构组织,主要包括以下几个部分:
.chart-container 主容器,包含标题、画布和图例
#lineChart canvas 元素,用于实际绘图
.legend 图例区域,显示各个数据系列及其开关按钮
.tooltip 浮动提示框,鼠标悬停时展示详细信息
<div class="chart-container"> <div class="chart-title">销售数据趋势图</div> <div id="chart"> <canvas id="lineChart"></canvas> </div> <div class="legend" id="legend"></div></div><div class="tooltip" id="tooltip"></div>
核心功能实现
初始化图表类
首先我们定义了一个 LineChart 类来封装所有的图表行为。其构造函数接收 canvas ID 和配置参数。class LineChart { constructor(canvasId, options) { this.canvas = document.getElementById(canvasId); this.ctx = this.canvas.getContext('2d'); this.options = options; this.data = options.data; this.tooltip = document.getElementById('tooltip'); this.legend = document.getElementById('legend');
this.padding = { top: 40, right: 40, bottom: 60, left: 60 }; this.colors = ['#4da6ff', '#00e6b8', '#ffcc00', '#ff6666', '#b3b3ff']; this.hiddenSeries = new Set();
this.init(); }}
绘图流程
初始化完成后,依次执行以下步骤完成图表绘制:
调整画布大小 (resizeCanvas):根据父容器自动缩放;
绘制主图内容 (draw):清空画布后调用其他绘图子方法;
创建底部图例 (createLegend):动态生成图例项;
绑定事件监听器 (bindEvents):处理鼠标移动与离开事件。
init() { this.resizeCanvas(); this.draw(); this.createLegend(); this.bindEvents(); window.addEventListener('resize', () => { this.resizeCanvas(); this.draw(); });}
各部件绘制详解
网格线绘制
drawGrid() { const { width, height } = this.canvas; const { top, right, bottom, left } = this.padding; const chartHeight = height - top - bottom;
this.ctx.strokeStyle = 'rgba(0, 0, 0, 0.15)'; this.ctx.lineWidth = 1; const ySteps = 5; for (let i = 0; i <= ySteps; i++) { const y = top + (chartHeight / ySteps) * i; this.ctx.beginPath(); this.ctx.moveTo(left, y); this.ctx.lineTo(width - right, y); this.ctx.stroke(); }}
坐标轴与标签
drawAxes() { const { width, height } = this.canvas; const { top, right, bottom, left } = this.padding; this.ctx.strokeStyle = 'rgba(0, 0, 0, 0.5)'; this.ctx.lineWidth = 2; this.ctx.beginPath(); this.ctx.moveTo(left, height - bottom); this.ctx.lineTo(width - right, height - bottom); this.ctx.stroke(); this.ctx.beginPath(); this.ctx.moveTo(left, top); this.ctx.lineTo(left, height - bottom); this.ctx.stroke(); this.drawLabels();}
数据线条与点
循环遍历每个数据系列,计算出每一点的像素位置并连线描点。drawLines() { const { width, height } = this.canvas; const { top, right, bottom, left } = this.padding; const chartWidth = width - left - right; const chartHeight = height - top - bottom;
const maxValue = Math.max(...this.data.series.flatMap(s => s.data)); const xData = this.data.xAxis.data; const xStep = chartWidth / (xData.length - 1); const yScale = chartHeight / maxValue;
this.data.series.forEach((series, seriesIndex) => { if (this.hiddenSeries.has(seriesIndex)) return; this.ctx.strokeStyle = this.colors[seriesIndex % this.colors.length]; this.ctx.lineWidth = 2; this.ctx.beginPath(); series.data.forEach((value, index) => { const x = left + xStep * index; const y = top + chartHeight - value * yScale; if (index === 0) { this.ctx.moveTo(x, y); } else { this.ctx.lineTo(x, y); } }); this.ctx.stroke(); });}
动态交互功能
通过监听 mousemove 事件捕捉最近的数据点并在浮动层上显示相关信息;点击图例则切换对应曲线的可见状态。handleMouseMove(e) { const rect = this.canvas.getBoundingClientRect(); const mouseX = e.clientX - rect.left; const { width, height } = this.canvas; const { top, right, bottom, left } = this.padding; const chartWidth = width - left - right; const xData = this.data.xAxis.data; const xStep = chartWidth / (xData.length - 1); let closestIndex = -1; let minDistance = Infinity; xData.forEach((_, index) => { const px = left + xStep * index; const distance = Math.abs(mouseX - px); if (distance < minDistance && distance < 20) { minDistance = distance; closestIndex = index; } }); if (closestIndex !== -1) { let tooltipHTML = `<div style="font-weight: bold; margin-bottom: 5px;">${xData[closestIndex]}</div>`; this.data.series.forEach((series, seriesIndex) => { if (!this.hiddenSeries.has(seriesIndex)) { const value = series.data[closestIndex]; const color = this.colors[seriesIndex % this.colors.length]; tooltipHTML += `<div style="display: flex; align-items: center; margin: 3px 0;"> <div style="width: 10px; height: 10px; background-color: ${color}; border-radius: 50%; margin-right: 5px;"></div> ${series.name}: ${value} </div>`; } }); this.tooltip.innerHTML = tooltipHTML; this.tooltip.style.display = 'block'; this.tooltip.style.left = e.clientX + 10 + 'px'; this.tooltip.style.top = e.clientY - 10 + 'px'; } else { this.tooltip.style.display = 'none'; }}
扩展建议
完整代码
git地址:https://gitee.com/ironpro/hjdemo/blob/master/chart-line/index.html<!DOCTYPE html><html lang="zh-CN"><head> <meta charset="utf-8"> <meta name="viewport" content="width=device-width, initial-scale=1.0"> <title>仿ECharts折线图</title> <style> * { margin: 0; padding: 0; box-sizing: border-box; } body { background-color: #f5f5f5; margin: 0; padding: 20px; min-height: 100vh; }
.chart-container { background: rgba(255, 255, 255, 0.08); border-radius: 16px; box-shadow: 0 8px 32px rgba(0, 0, 0, 0.3); padding: 25px; max-width: 800px; margin: 0 auto; border: 1px solid rgba(255, 255, 255, 0.1); backdrop-filter: blur(14px); }
.chart-title { text-align: center; font-size: 20px; font-weight: 600; margin-bottom: 25px; letter-spacing: 0.5px; }
#chart { position: relative; width: 100%; height: 400px; }
.tooltip { position: fixed; background: rgba(30, 30, 30, 0.9); color: white; padding: 10px 15px; border-radius: 8px; font-size: 13px; pointer-events: none; display: none; z-index: 1000; backdrop-filter: blur(4px); border: 1px solid rgba(255, 255, 255, 0.15); box-shadow: 0 4px 20px rgba(0, 0, 0, 0.3); transition: opacity 0.2s ease; }
.legend { display: flex; justify-content: center; margin-top: 25px; flex-wrap: wrap; gap: 15px; }
.legend-item { display: flex; align-items: center; cursor: pointer; transition: all 0.3s ease; padding: 6px 14px; border-radius: 20px; background: rgba(255, 255, 255, 0.05); }
.legend-item:hover { background: rgba(255, 255, 255, 0.15); }
.legend-color { width: 14px; height: 14px; border-radius: 50%; margin-right: 8px; }
.legend-text { font-weight: 500; }
.legend-item.inactive { opacity: 0.3; } </style></head><body><div class="chart-container"> <div class="chart-title">销售数据趋势图</div> <div id="chart"> <canvas id="lineChart"></canvas> </div> <div class="legend" id="legend"></div></div><div class="tooltip" id="tooltip"></div>
<script> class LineChart { constructor(canvasId, options) { this.canvas = document.getElementById(canvasId); this.ctx = this.canvas.getContext('2d'); this.options = options; this.data = options.data; this.tooltip = document.getElementById('tooltip'); this.legend = document.getElementById('legend');
this.padding = { top: 40, right: 40, bottom: 60, left: 60 }; this.colors = ['#4da6ff', '#00e6b8', '#ffcc00', '#ff6666', '#b3b3ff']; this.hiddenSeries = new Set();
this.init(); }
init() { this.resizeCanvas(); this.draw(); this.createLegend(); this.bindEvents(); window.addEventListener('resize', () => { this.resizeCanvas(); this.draw(); }); }
resizeCanvas() { const container = this.canvas.parentElement; this.canvas.width = container.offsetWidth; this.canvas.height = container.offsetHeight; }
draw() { this.ctx.clearRect(0, 0, this.canvas.width, this.canvas.height); this.drawGrid(); this.drawAxes(); this.drawLines(); this.drawPoints(); }
drawGrid() { const { width, height } = this.canvas; const { top, right, bottom, left } = this.padding; const chartHeight = height - top - bottom;
this.ctx.strokeStyle = 'rgba(0, 0, 0, 0.15)'; this.ctx.lineWidth = 1; const ySteps = 5; for (let i = 0; i <= ySteps; i++) { const y = top + (chartHeight / ySteps) * i; this.ctx.beginPath(); this.ctx.moveTo(left, y); this.ctx.lineTo(width - right, y); this.ctx.stroke(); } }
drawAxes() { const { width, height } = this.canvas; const { top, right, bottom, left } = this.padding; this.ctx.strokeStyle = 'rgba(0, 0, 0, 0.5)'; this.ctx.lineWidth = 2; this.ctx.beginPath(); this.ctx.moveTo(left, height - bottom); this.ctx.lineTo(width - right, height - bottom); this.ctx.stroke(); this.ctx.beginPath(); this.ctx.moveTo(left, top); this.ctx.lineTo(left, height - bottom); this.ctx.stroke(); this.drawLabels(); }
drawLabels() { const { width, height } = this.canvas; const { top, right, bottom, left } = this.padding; const chartWidth = width - left - right; const chartHeight = height - top - bottom;
this.ctx.fillStyle = 'rgba(0, 0, 0, 0.7)'; this.ctx.font = '14px Arial'; this.ctx.textAlign = 'center'; const xData = this.data.xAxis.data; const step = chartWidth / (xData.length - 1); xData.forEach((label, index) => { const x = left + step * index; this.ctx.fillText(label, x, height - bottom + 20); }); this.ctx.textAlign = 'right'; const maxValue = Math.max(...this.data.series.flatMap(s => s.data)); const ySteps = 5; for (let i = 0; i <= ySteps; i++) { const value = Math.round((maxValue / ySteps) * (ySteps - i)); const y = top + (chartHeight / ySteps) * i; this.ctx.fillText(value, left - 10, y + 5); } this.ctx.fillStyle = 'rgba(0, 0, 0, 0.9)'; this.ctx.font = '14px Arial'; this.ctx.textAlign = 'center'; this.ctx.fillText(this.data.xAxis.name, width / 2, height - 10);
this.ctx.save(); this.ctx.translate(15, height / 2); this.ctx.rotate(-Math.PI / 2); this.ctx.fillText(this.data.yAxis.name, 0, 0); this.ctx.restore(); }
drawLines() { const { width, height } = this.canvas; const { top, right, bottom, left } = this.padding; const chartWidth = width - left - right; const chartHeight = height - top - bottom;
const maxValue = Math.max(...this.data.series.flatMap(s => s.data)); const xData = this.data.xAxis.data; const xStep = chartWidth / (xData.length - 1); const yScale = chartHeight / maxValue;
this.data.series.forEach((series, seriesIndex) => { if (this.hiddenSeries.has(seriesIndex)) return; this.ctx.strokeStyle = this.colors[seriesIndex % this.colors.length]; this.ctx.lineWidth = 2; this.ctx.beginPath(); series.data.forEach((value, index) => { const x = left + xStep * index; const y = top + chartHeight - value * yScale; if (index === 0) { this.ctx.moveTo(x, y); } else { this.ctx.lineTo(x, y); } }); this.ctx.stroke(); }); }
drawPoints() { const { width, height } = this.canvas; const { top, right, bottom, left } = this.padding; const chartWidth = width - left - right; const chartHeight = height - top - bottom;
const maxValue = Math.max(...this.data.series.flatMap(s => s.data)); const xData = this.data.xAxis.data; const xStep = chartWidth / (xData.length - 1); const yScale = chartHeight / maxValue;
this.data.series.forEach((series, seriesIndex) => { if (this.hiddenSeries.has(seriesIndex)) return;
this.ctx.fillStyle = this.colors[seriesIndex % this.colors.length];
series.data.forEach((value, index) => { const x = left + xStep * index; const y = top + chartHeight - value * yScale;
this.ctx.beginPath(); this.ctx.arc(x, y, 4, 0, Math.PI * 2); this.ctx.fill();
this.ctx.strokeStyle = '#fff'; this.ctx.lineWidth = 2; this.ctx.stroke(); }); }); }
createLegend() { this.legend.innerHTML = ''; this.data.series.forEach((series, index) => { const item = document.createElement('div'); item.className = 'legend-item'; item.innerHTML = `<div class="legend-color" style="background-color: ${this.colors[index % this.colors.length]}"></div> <div class="legend-text">${series.name}</div>`;
item.addEventListener('click', () => { if (this.hiddenSeries.has(index)) { this.hiddenSeries.delete(index); item.classList.remove('inactive'); } else { this.hiddenSeries.add(index); item.classList.add('inactive'); } this.draw(); });
this.legend.appendChild(item); }); }
bindEvents() { this.canvas.addEventListener('mousemove', (e) => { this.handleMouseMove(e); });
this.canvas.addEventListener('mouseleave', () => { this.tooltip.style.display = 'none'; }); }
handleMouseMove(e) { const rect = this.canvas.getBoundingClientRect(); const mouseX = e.clientX - rect.left; const { width, height } = this.canvas; const { top, right, bottom, left } = this.padding; const chartWidth = width - left - right; const xData = this.data.xAxis.data; const xStep = chartWidth / (xData.length - 1); let closestIndex = -1; let minDistance = Infinity; xData.forEach((_, index) => { const px = left + xStep * index; const distance = Math.abs(mouseX - px); if (distance < minDistance && distance < 20) { minDistance = distance; closestIndex = index; } }); if (closestIndex !== -1) { let tooltipHTML = `<div style="font-weight: bold; margin-bottom: 5px;">${xData[closestIndex]}</div>`; this.data.series.forEach((series, seriesIndex) => { if (!this.hiddenSeries.has(seriesIndex)) { const value = series.data[closestIndex]; const color = this.colors[seriesIndex % this.colors.length]; tooltipHTML += `<div style="display: flex; align-items: center; margin: 3px 0;"> <div style="width: 10px; height: 10px; background-color: ${color}; border-radius: 50%; margin-right: 5px;"></div> ${series.name}: ${value} </div>`; } }); this.tooltip.innerHTML = tooltipHTML; this.tooltip.style.display = 'block'; this.tooltip.style.left = e.clientX + 10 + 'px'; this.tooltip.style.top = e.clientY - 10 + 'px'; } else { this.tooltip.style.display = 'none'; } } } const chartData = { xAxis: { name: '月份', data: ['1月', '2月', '3月', '4月', '5月', '6月', '7月', '8月', '9月', '10月', '11月', '12月'] }, yAxis: { name: '销售额(万元)' }, series: [ { name: '产品A', data: [120, 132, 101, 134, 90, 230, 210, 182, 191, 234, 290, 330] }, { name: '产品B', data: [220, 182, 191, 234, 290, 330, 310, 323, 334, 390, 330, 320] }, { name: '产品C', data: [150, 232, 201, 154, 190, 330, 410, 402, 334, 390, 430, 420] } ] }; const lineChart = new LineChart('lineChart', { data: chartData });</script></body></html>
阅读原文:https://mp.weixin.qq.com/s/Ebefo1b_vso2qznWTxoN9Q
该文章在 2025/12/15 9:07:22 编辑过


 400 186 1886


