在企业管理系统或团队协作平台中,组织结构图是一种重要的可视化工具,能够清晰地展示公司的层级关系和人员分布。本文将详细介绍如何使用 HTML、CSS 和 JavaScript 从零开始构建一个具有交互功能的组织结构图。效果演示
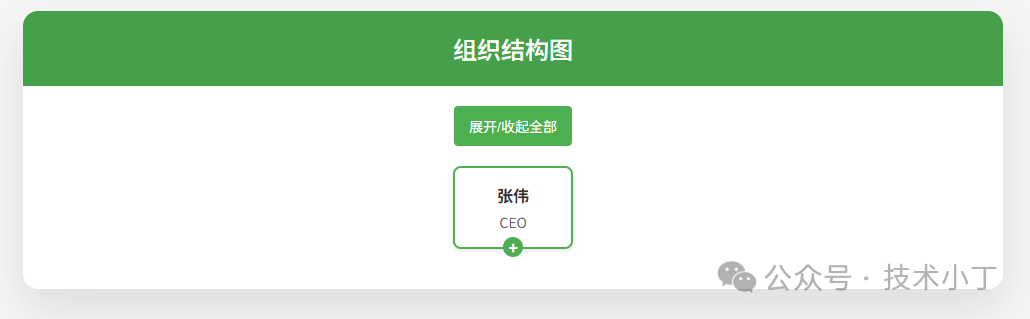
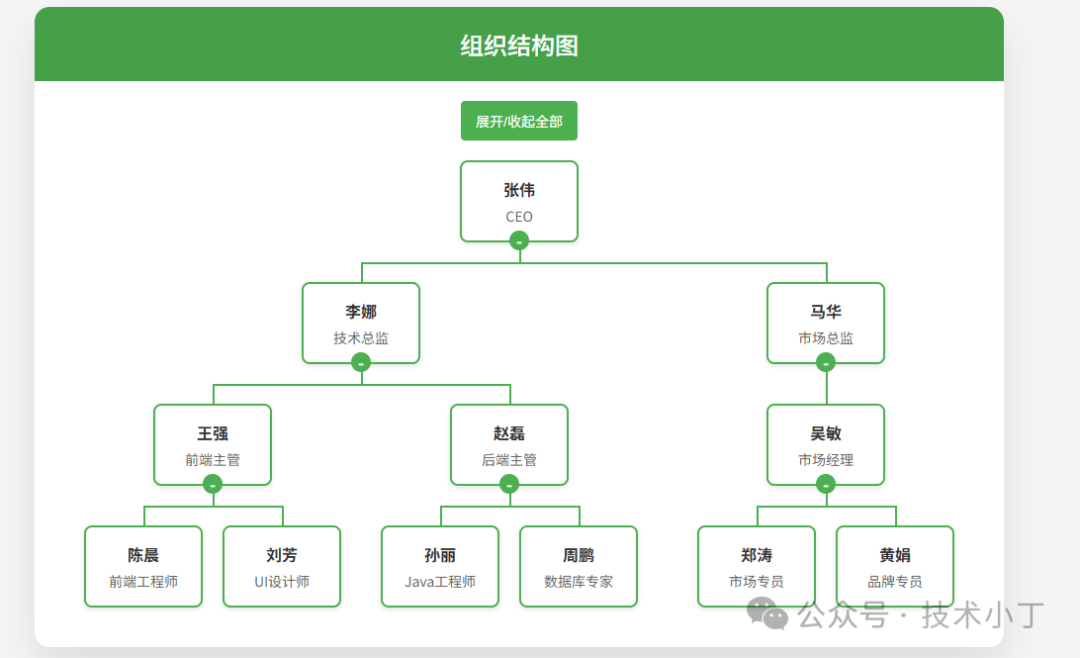
本项目呈现了一个典型的公司组织架构,从上级开始逐层向下展示各个部门及员工职位。用户可以通过点击节点上的 +/- 按钮来展开或收起子节点,也可以通过顶部的“展开/收起全部”按钮一键控制所有节点的状态。默认情况下,部分节点被设置为收起状态以避免图表过于庞大,用户可以根据需要自由展开查看详细信息。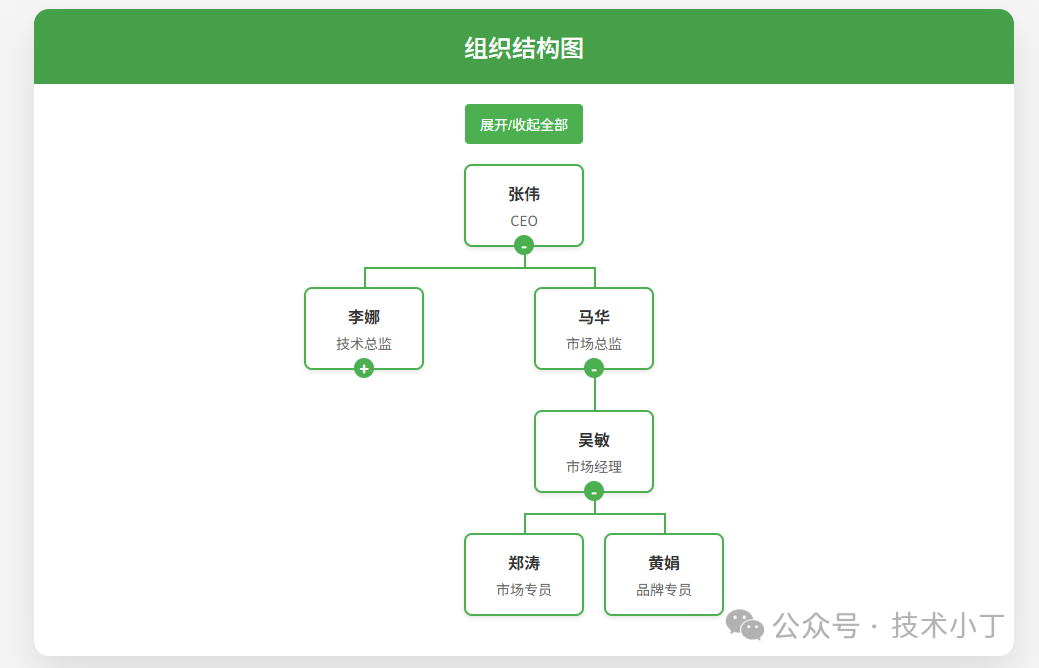
页面结构
操作区域
该区域位于主内容上方,提供全局操作按钮,目前只有一个“展开/收起全部”的功能按钮,用户可以一键控制所有节点的展开状态。<div class="actions"> <button onclick="toggleAll()">展开/收起全部</button></div>
组织结构图区域
<div class="org-chart-container"> <div class="org-chart" id="orgChart"></div></div>
核心功能实现
数据结构定义
组织结构图的数据源是一个嵌套的 json 数据,每个节点包含 id、name、position 和 children 属性。这种树形数据结构非常适合表示层级关系,并且易于遍历和渲染。var orgData = { id: 1, name: "张伟", position: "CEO", children: [ { id: 2, name: "李娜", position: "技术总监", children: [ ] }, ]};
节点渲染逻辑
使用递归方式渲染整个组织结构图,通过递归遍历数据结构,为每个节点创建对应的DOM元素,并根据是否有子节点添加相应的CSS类名。function renderOrgChart(data, container) { var nodeEl = document.createElement('div'); nodeEl.className = 'node'; nodeEl.dataset.id = data.id;
if (data.children && data.children.length > 0) { nodeEl.classList.add('has-children'); }
nodeEl.innerHTML = ` <div class="title">${data.name}</div> <div class="position">${data.position}</div> <div class="toggle-btn"></div> `; if (data.children && data.children.length > 0) { const toggleBtn = nodeEl.querySelector('.toggle-btn'); toggleBtn.addEventListener('click', function(e) { e.stopPropagation(); nodeEl.classList.toggle('collapsed'); }); }
container.appendChild(nodeEl);
if (data.children && data.children.length > 0) { var childrenEl = document.createElement('div'); childrenEl.className = 'children';
data.children.forEach((child, index) => { var childWrapper = document.createElement('div'); childWrapper.className = 'child';
if (data.children.length === 1) { childWrapper.classList.add('only-child'); } else if (index === 0) { childWrapper.classList.add('first-child'); } else if (index === data.children.length - 1) { childWrapper.classList.add('last-child'); }
renderOrgChart(child, childWrapper); childrenEl.appendChild(childWrapper); });
container.appendChild(childrenEl); }
if (data.id === 2 || data.id === 4) { nodeEl.classList.add('collapsed'); }}
节点展开/收起功能
通过给节点添加/移除 .collapsed 类来控制子节点的显示与隐藏。CSS 中利用相邻兄弟选择器来隐藏被收起节点的子级容器;同时,通过伪元素 ::after 在节点下方显示 +/- 按钮,提升用户体验。(相关事件在“节点渲染逻辑”中“为切换按钮添加点击事件”绑定)
全部展开/收起
首先判断当前是否所有节点都处于收起状态,然后统一执行相反的操作。function toggleAll() { var nodes = document.querySelectorAll('.node.has-children'); var isAllCollapsed = Array.from(nodes).every(node => node.classList.contains('collapsed'));
nodes.forEach(node => { if (isAllCollapsed) { node.classList.remove('collapsed'); } else { node.classList.add('collapsed'); } });}
扩展建议
完整代码
git地址:https://gitee.com/ironpro/hjdemo/blob/master/orgchart/index.html<!DOCTYPE html><html lang="zh-CN"><head> <meta charset="UTF-8"> <meta name="viewport" content="width=device-width, initial-scale=1.0"> <title>组织结构图</title> <style> * { margin: 0; padding: 0; box-sizing: border-box; } body { background-color: #f5f5f5; min-height: 100vh; padding: 20px; } .container { max-width: 980px; margin: 0 auto; background: white; border-radius: 15px; box-shadow: 0 20px 40px rgba(0,0,0,0.1); overflow: hidden; } .header { background: #45a049; color: white; padding: 20px; text-align: center; } .header h1 { font-size: 24px; font-weight: 500; } .main { padding: 20px; } .org-chart-container { display: flex; justify-content: center; overflow: auto; padding: 20px 0; } .org-chart { display: flex; flex-direction: column; align-items: center; position: relative; }
.node { background-color: white; border: 2px solid #4CAF50; border-radius: 8px; padding: 15px; width: 120px; text-align: center; box-shadow: 0 2px 5px rgba(0,0,0,0.1); position: relative; cursor: pointer; transition: all 0.3s ease; display: inline-block; }
.node:hover { box-shadow: 0 4px 10px rgba(0,0,0,0.5); }
.node .title { font-weight: bold; color: #333; margin-bottom: 5px; }
.node .position { color: #666; font-size: 14px; }
.children { display: flex; justify-content: center; margin-top: 40px; position: relative; }
.children::before { content: ''; position: absolute; top: -40px; left: 50%; width: 2px; height: 20px; background-color: #4CAF50; }
.child { position: relative; padding: 0 10px; text-align: center; }
.child::before { content: ''; position: absolute; top: -20px; left: 50%; width: 2px; height: 20px; background-color: #4CAF50; }
.child::after { content: ''; position: absolute; top: -20px; left: 0; width: 100%; height: 2px; background-color: #4CAF50; }
.first-child::after { width: 50%; left: 50%; }
.last-child::after { width: 50%; }
.only-child::after { width: 0; }
.actions { text-align: center; }
button { background-color: #4CAF50; color: white; border: none; padding: 10px 15px; border-radius: 4px; cursor: pointer; margin: 0 5px; font-size: 14px; }
button:hover { background-color: #45a049; }
.node.collapsed + .children { display: none; } .node .toggle-btn::after { content: '-'; position: absolute; bottom: -10px; left: 50%; transform: translateX(-50%); width: 20px; height: 20px; background-color: #4CAF50; color: white; border-radius: 50%; display: flex; align-items: center; justify-content: center; font-weight: bold; font-size: 16px; z-index: 9; cursor: pointer; } .node.collapsed .toggle-btn::after { content: '+'; } .node:not(.has-children) .toggle-btn { display: none; } </style></head><body><div class="container"> <div class="header"> <h1>组织结构图</h1> </div> <div class="main"> <div class="actions"> <button onclick="toggleAll()">展开/收起全部</button> </div> <div class="org-chart-container"> <div class="org-chart" id="orgChart"></div> </div> </div></div><script> var orgData = { id: 1, name: "张伟", position: "CEO", children: [ { id: 2, name: "李娜", position: "技术总监", children: [ { id: 4, name: "王强", position: "前端主管", children: [ { id: 7, name: "陈晨", position: "前端工程师" }, { id: 8, name: "刘芳", position: "UI设计师" } ] }, { id: 5, name: "赵磊", position: "后端主管", children: [ { id: 9, name: "孙丽", position: "Java工程师" }, { id: 10, name: "周鹏", position: "数据库专家" } ] } ] }, { id: 3, name: "马华", position: "市场总监", children: [ { id: 6, name: "吴敏", position: "市场经理", children: [ { id: 11, name: "郑涛", position: "市场专员" }, { id: 12, name: "黄娟", position: "品牌专员" } ] } ] } ] };
function renderOrgChart(data, container) { var nodeEl = document.createElement('div'); nodeEl.className = 'node'; nodeEl.dataset.id = data.id;
if (data.children && data.children.length > 0) { nodeEl.classList.add('has-children'); }
nodeEl.innerHTML = ` <div class="title">${data.name}</div> <div class="position">${data.position}</div> <div class="toggle-btn"></div> `; if (data.children && data.children.length > 0) { const toggleBtn = nodeEl.querySelector('.toggle-btn'); toggleBtn.addEventListener('click', function(e) { e.stopPropagation(); nodeEl.classList.toggle('collapsed'); }); }
container.appendChild(nodeEl);
if (data.children && data.children.length > 0) { var childrenEl = document.createElement('div'); childrenEl.className = 'children';
data.children.forEach((child, index) => { var childWrapper = document.createElement('div'); childWrapper.className = 'child';
if (data.children.length === 1) { childWrapper.classList.add('only-child'); } else if (index === 0) { childWrapper.classList.add('first-child'); } else if (index === data.children.length - 1) { childWrapper.classList.add('last-child'); }
renderOrgChart(child, childWrapper); childrenEl.appendChild(childWrapper); });
container.appendChild(childrenEl); }
if (data.id === 2 || data.id === 4) { nodeEl.classList.add('collapsed'); } }
function initOrgChart() { var container = document.getElementById('orgChart'); container.innerHTML = ''; renderOrgChart(orgData, container); }
function toggleAll() { var nodes = document.querySelectorAll('.node.has-children'); var isAllCollapsed = Array.from(nodes).every(node => node.classList.contains('collapsed'));
nodes.forEach(node => { if (isAllCollapsed) { node.classList.remove('collapsed'); } else { node.classList.add('collapsed'); } }); }
initOrgChart();</script></body></html>
阅读原文:原文链接
该文章在 2025/12/15 9:11:54 编辑过


 400 186 1886